Diagnosing and Fixing Crowd Performance in a Unity/WebGL Third-Person Game
A comprehensive post-mortem detailing how profiler-first investigation resolved a complex rendering bottleneck involving NavMesh crowds, broken LOD culling, modular skinned meshes, and deceptive GC plateaus.
40+ NPCs
NavMesh-driven60+ FPS
Stable WebGL26 MB
Budget: <50 MBProfiler-1st
Zero guessworkThe Premise
Context: Cat Distribution Network is a third-person game where the player controls a cat navigating a small town populated by 40+ NavMesh-driven NPCs on WebGL.
Starting point: With NPCs in the scene, the frame rate dropped well below target. With NPCs removed entirely, the same scene ran comfortably above 60 FPS — confirming the crowd was the bottleneck, but not yet explaining why.
“This case study walks through the investigation as it actually happened: several distinct problems, stacked on top of each other, each one only visible once the previous layer was peeled back. That iterative process — not just the final fix — is the point of writing this up.”
Starting the Investigation
The existing CharacterPerson NPC controller already had performance-conscious architecture:
- Coroutine-based patrol logic instead of per-frame
Update()polling. - Pooled
WaitForSecondsinstances to eliminate garbage collection churn. Animator.cullingMode = CullCompletelyto skip animation evaluation off-screen.- Custom distance-based AI LOD reducing NavMeshAgent obstacle-avoidance quality and patrol frequency for distant characters.
None of that explained the sluggish frame rate. Rather than assuming the existing LOD system was broken, the first step was pulling up the Unity Profiler’s CPU Usage and Rendering modules to observe where frame time was actually spent.
First Read of the Profiler
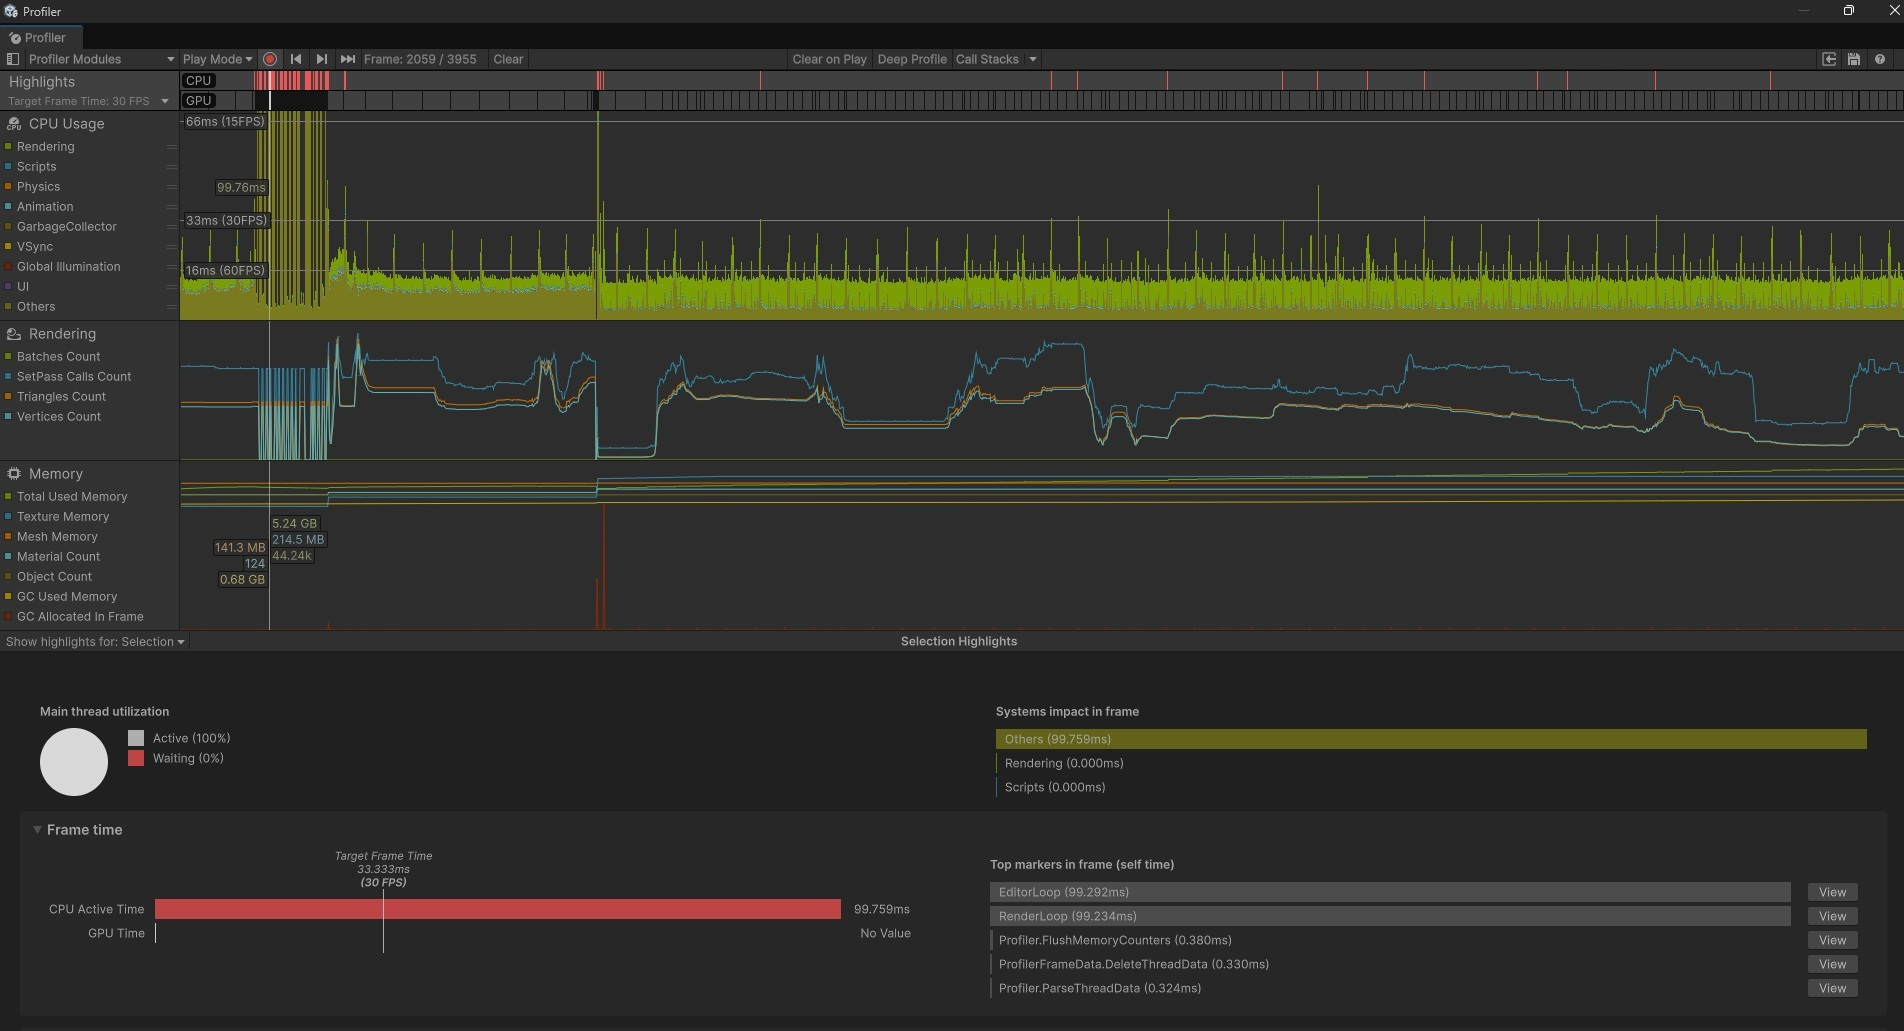
Scripts, Physics, Animation, and GC were all negligible — sub-millisecond, completely flat. But the Rendering counters (Batches, SetPass Calls, Triangles, Vertices) were oscillating in a wave tracking frame time almost exactly, swinging between roughly 600 and 1,800.
→ Signal: The bottleneck was rendering submission cost, not scripts or physics, despite the crowd being NavMeshAgent-driven and script-heavy on paper.
Root Cause #1: LOD Culling Wasn't Actually Culling
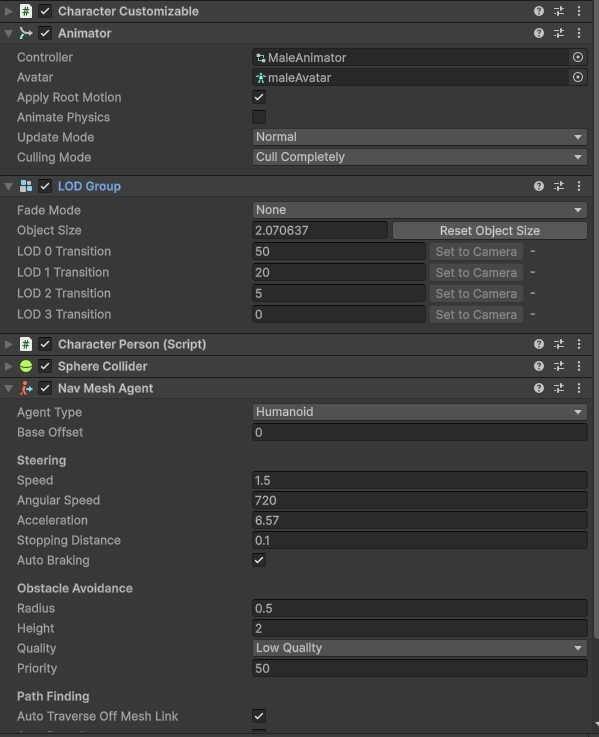
Inspecting the LODGroup on the character prefab revealed a critical flaw: LOD 3's transition was set to 0%. This meant there was no “Culled” region below it.
In a normal LOD pipeline, once a character's on-screen size drops below the last threshold, Unity disables the renderer entirely (zero draw calls, zero cost). Here, because LOD 3 extended all the way to 0%, every character kept rendering its lowest-detail mesh forever, regardless of distance — even characters barely a few pixels tall near the camera's far clip plane.
Diagnosis Summary:
LOD transitions (0 → 1 → 2 → 3) switched correctly at screen-size thresholds, but LOD culling — the actual cost-saving mechanism — never engaged.
Fix: Raised LOD 3's transition off 0%, establishing an explicit cutoff distance where distant characters cease rendering entirely.
Root Cause #2: Empty Renderers Paying Full Skinning Cost
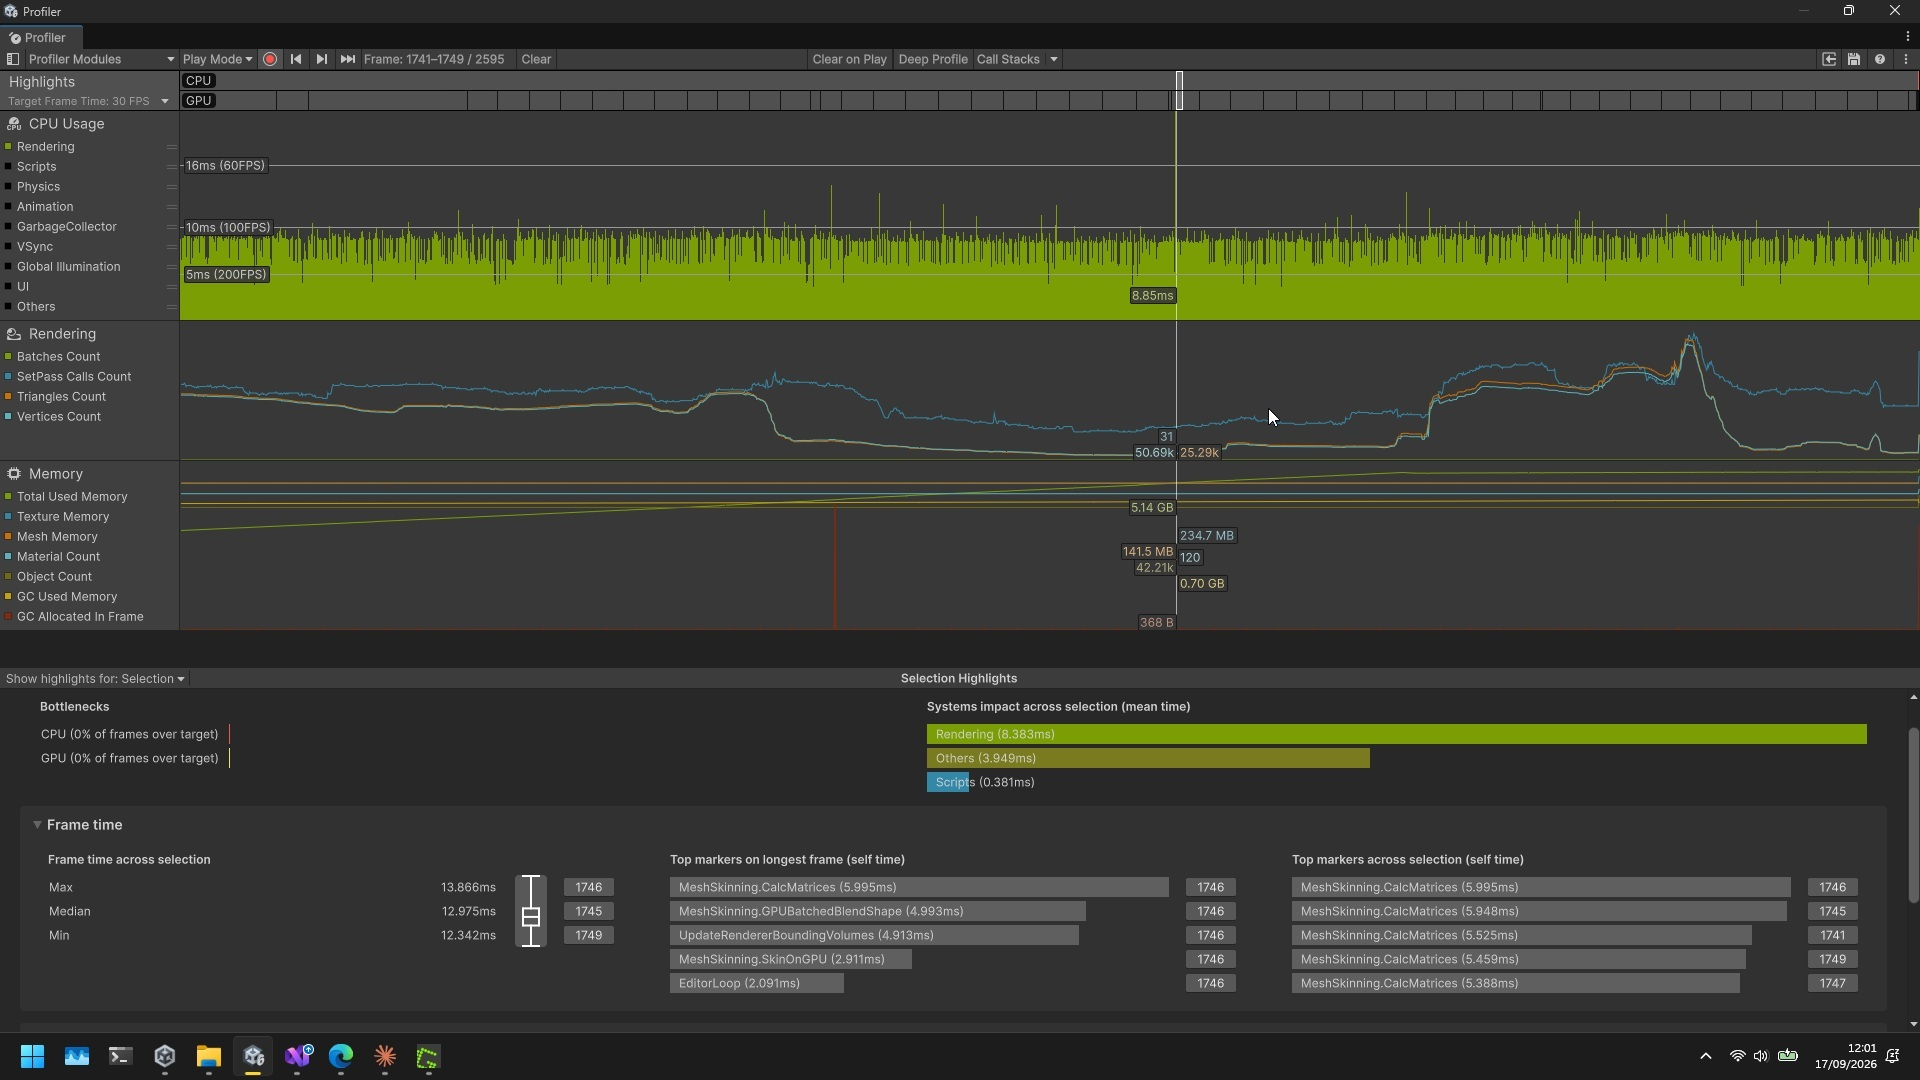
After applying the culling fix, frame time improved noticeably. However, a new dominant cost surged in the profiler:
This pointed directly at mesh skinning overhead rather than general draw-call submission. Inspecting the character prefab explained why:
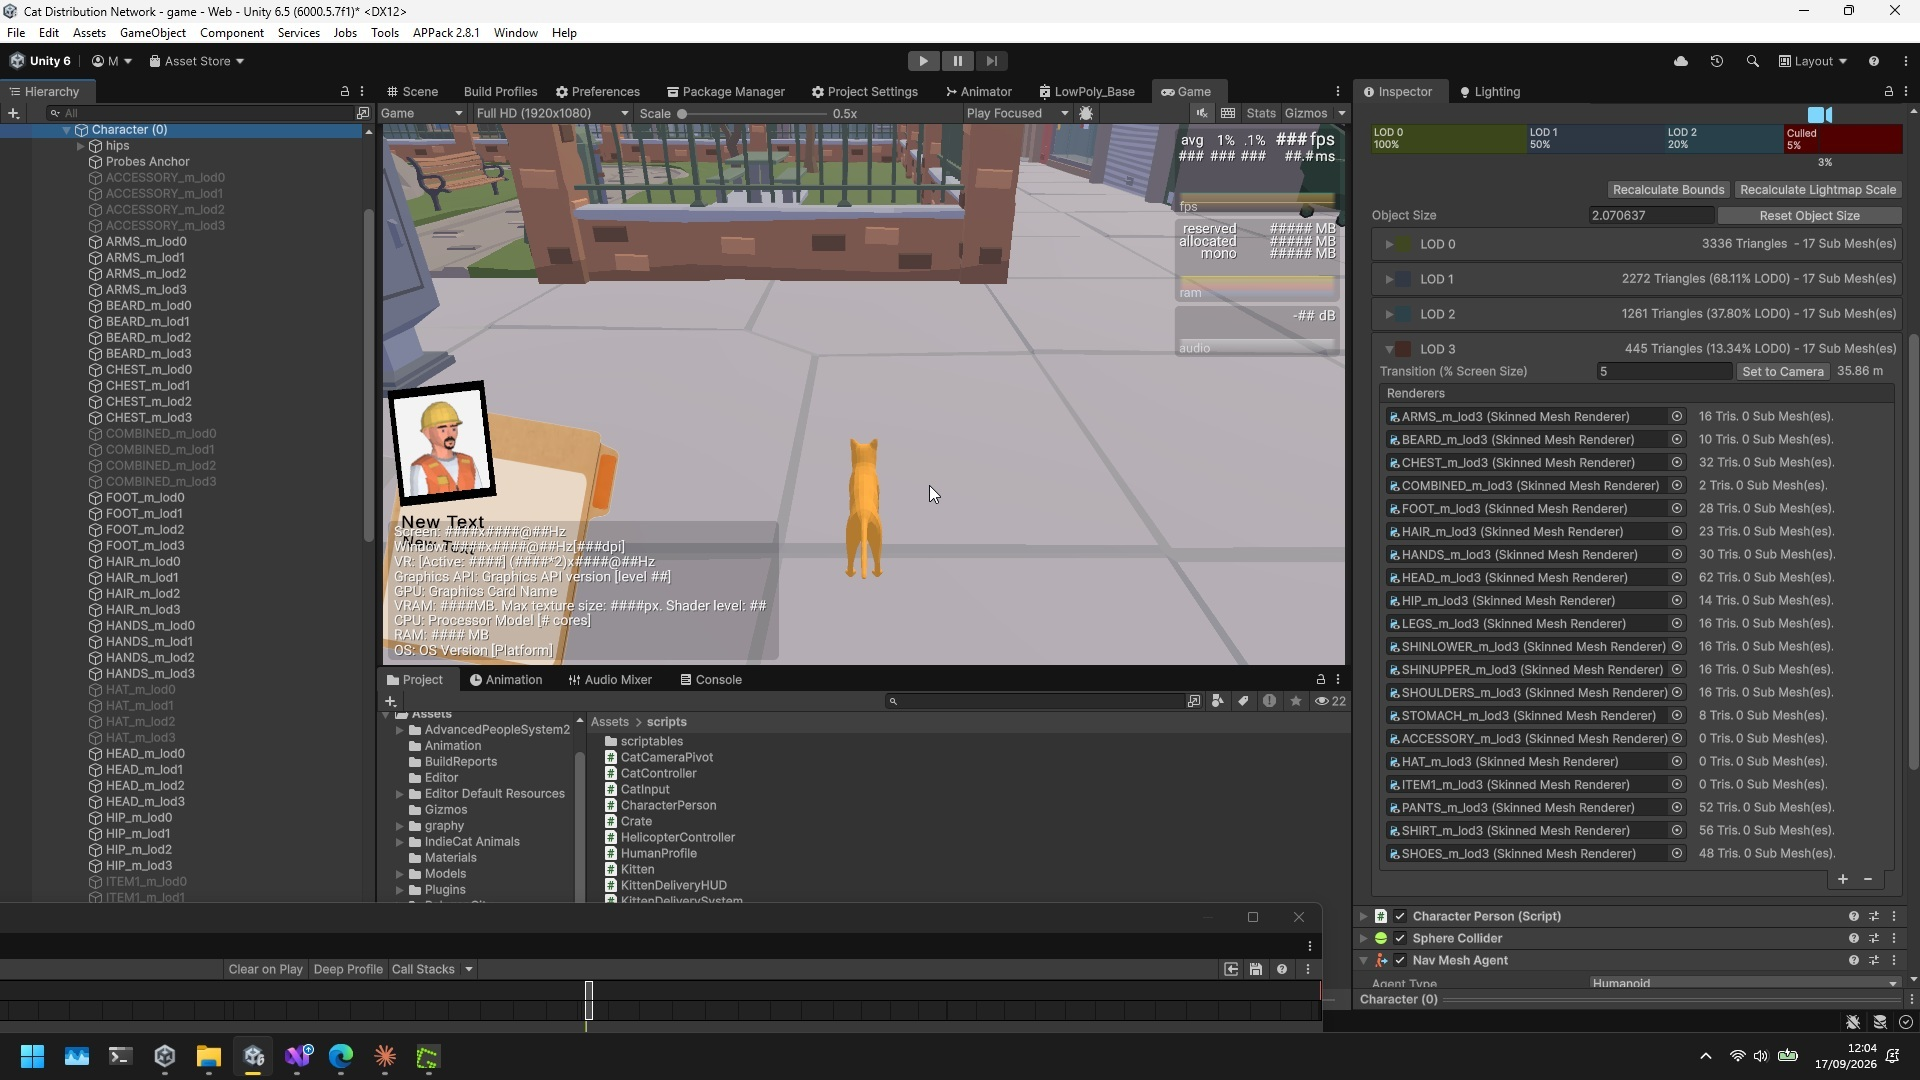
- Each NPC was constructed from a modular character system featuring 17 separate
SkinnedMeshRenderercomponents (arms, chest, hair, hands, head, hip, legs, shirt, pants, shoes, accessory, hat, item, etc.), bound to a shared humanoid skeleton and swapped per LOD. - Several slots (accessory, hat, item) were empty (0 triangles) on characters without those items equipped — yet their renderer components remained enabled.
- Each enabled component paid full per-frame tax: bone matrix computation, bounding volume updates, and skinning dispatches for non-existent geometry.
- Even at LOD 3 (445 total triangles), every character carried 17 renderer instances. In Unity, skinning and bounds overhead is driven heavily by renderer count, not just triangle count.
The Engineering Solution: Two-Part Fix
void Awake()
{
    _agent = GetComponent<NavMeshAgent>();
    _anim = GetComponent<Animator>();
    if (_anim == null) _anim = GetComponentInChildren<Animator>();
    if (_anim != null) _anim.cullingMode = AnimatorCullingMode.CullCompletely;

    // Disable renderer slots with no geometry (unequipped accessory/hat/item),
    // so they don't cost bone-matrix/bounds updates every frame.
    foreach (var smr in GetComponentsInChildren<SkinnedMeshRenderer>())
    {
        if (smr.sharedMesh == null || smr.sharedMesh.vertexCount == 0)
        {
            smr.enabled = false;
        }
    }
}
Fix Part 2: Merged the 17 modular skinned meshes into fewer combined renderers, cutting the fixed per-renderer overhead that every character paid regardless of equipped items or LOD tier.
A Dead End Worth Including: Chasing a GC Hypothesis That Wasn't the Cause
Later in the same play session, two clearly separated stretches of frames revealed an alarming failure mode: sustained multi-frame CPU plateaus (30–66ms for multiple consecutive frames) rather than isolated spikes. These plateaus visually correlated with denser clusters of GC allocation activity in the profiler timeline.
On WebGL, where garbage collection cannot run incrementally like on desktop, this immediately appeared to be GC pauses. Rather than assuming and modifying code speculatively, the investigation rigorously validated the hypothesis:
Step-by-Step Hypothesis Elimination:
- Hierarchy GC Inspection: Paused on a flagged frame and sorted the Hierarchy view by GC Alloc.
- Unmasking Tooling Artifacts: The frame was running in Editor Play Mode. The dominant cost was
EditorLoop / Profiler.WriteBuffer / UnityEngine.GUIUtility.BeginGUI(). This was Editor-only tooling overhead and IMGUI repaint, not gameplay execution! - Testing in Development Build: Deployed a clean Development Build outside of Editor Play Mode to eliminate tooling contamination.
- GC Ruled Out: In the clean build data, GC Alloc for the stalled frame was a trivial 72 bytes (originating from a third-party debug overlay, Graphy, rather than gameplay code).
- LOD Thrashing Ruled Out: Call counts for
MeshSkinning.CalcMatricesremained virtually unchanged from baseline (1,825 vs 1,827 calls). Thrashing between LOD levels would have produced a spike in call counts.
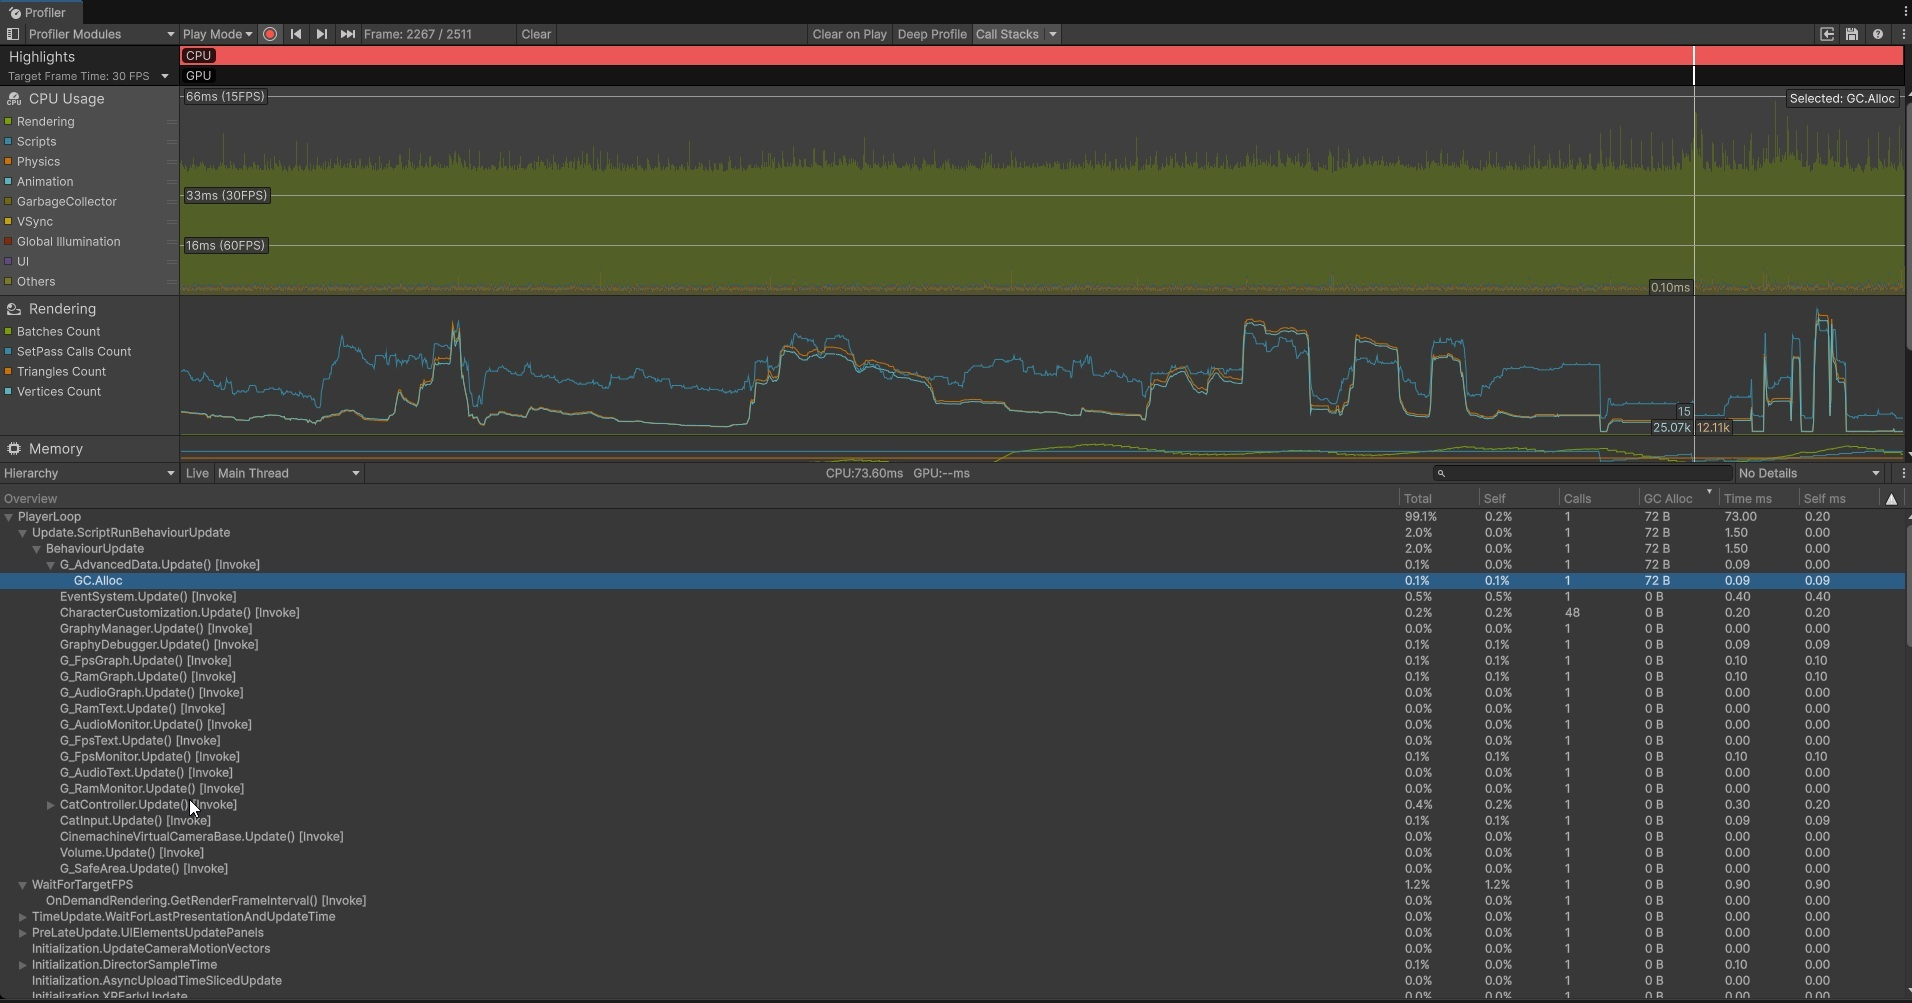
The Real Culprit: Call Count vs. Cost-Per-Call
What had actually changed was cost-per-call: MeshSkinning.Update exploded from ~5.4ms to ~54ms total, with MeshSkinning.Skin alone taking ~38ms self-time, despite the exact same number of renderer calls.
Cross-referencing with in-game footage revealed that when the third-person camera panned close to a cluster of 4–5 characters, their screen coverage expanded, shifting them from LOD 3 (445 triangles) to LOD 0 (3,336 triangles) — an 8x geometry jump per character simultaneously!
Fix: Tightened the LOD culling threshold to 5% and paired it with mesh merging, reducing both close-range polygon spikes and per-renderer overhead.
Additional Optimization Pass: Rendering Setup & Build Size
Alongside crowd optimization, a broader hygiene pass was executed for WebGL load-time targets:
Batching & Static Flags
Enabled material batching to lower draw calls; marked static world geometry as Static for Unity's static batching and precomputed lighting systems.
Asset Compression & Budgets
Downsampled uncompressed textures to strict platform resolution budgets and enabled mesh compression across character and environment assets.
Delivered at 26 MB against a 50 MB budget ceiling — directly reducing initial browser time-to-play.
What This Investigation Demonstrates
Profiler-First Debugging, Not Assumption-First
Every fix came from reading Profiler data (CPU Usage, Rendering counters, Hierarchy self-time, GC Alloc) rather than guessing from symptoms. Two plausible hypotheses (LOD thrashing, GC pressure) were actively tested and ruled out with data before moving forward.
Recognizing Tooling Artifacts
Distinguishing genuine gameplay cost from Editor-only overhead (EditorLoop, Profiler.WriteBuffer, IMGUI repaints) by re-testing in a Development Build prevented chasing phantom performance spikes.
Distinguishing Call Count from Cost-Per-Call
Comparing Calls and Self ms side-by-side across frames revealed that a 10x frame-time surge occurred with flat call counts — a diagnostic signature identifying per-vertex geometry expansion at close range.
Layered Problems, Layered Fixes
Four distinct issues (broken LOD culling, empty-but-enabled renderers, high per-renderer overhead from modular systems, and LOD0 scaling) were masking each other in layers. Real-world crowd rendering rarely has a single root cause.
Moses Kamau Mbugua
QA Engineer (PC & VR) · 8 Years Testing · 10 Years Engineering